(Volatile / Trend) ZERO LONG GAMMA
(Dampened / Range)
🔥 Active Order Flow & Strike Conviction (ATM ± 5)
Real-Time Volume & OI Shift| STRIKE | CALL OI (Lakhs) | CALL GEX (Cr) | CALL OI Δ | CALL GEX Δ | PCR | PUT OI (Lakhs) | PUT GEX (Cr) | PUT OI Δ | PUT GEX Δ | STATUS |
|---|
💡 Masterclass: Reading the Synopsis & Decision Suites Guide
Quantitative Microstructure Playbook1. Dealer Gamma Regime (GEX): Positive Net GEX (Long Gamma) forces dealers to buy dips and sell rallies to maintain delta-neutrality, dampening market volatility. Negative Net GEX (Short Gamma) forces dealers to sell as spot falls, triggering explosive trend breakouts.
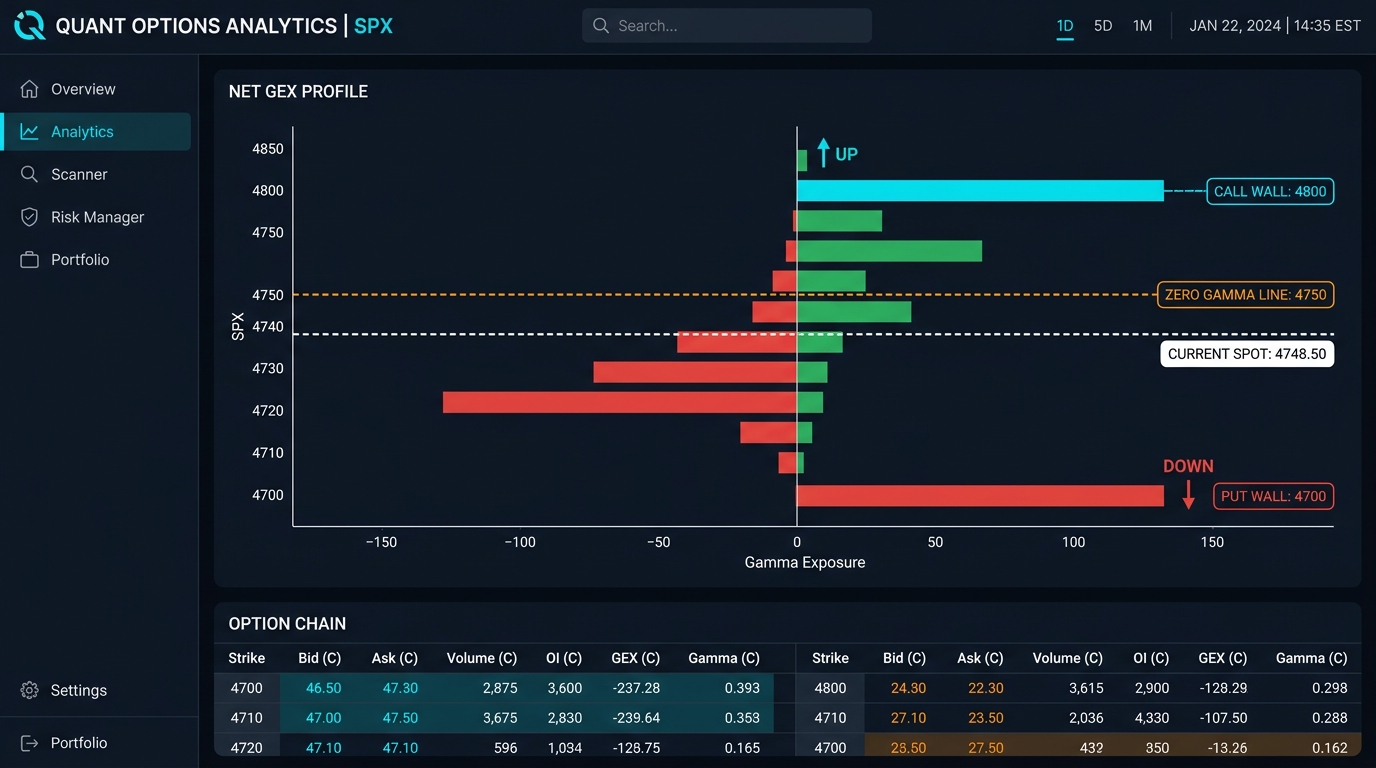
2. Zero Gamma Line (ZGL): The price level where aggregate dealer gamma flips polarity. A spot breakdown below ZGL shifts market regime from volatility-stabilizing to volatility-accelerating.
3. PCR Divergence: Comparing Volume PCR against OI PCR highlights fresh institutional order flow vs legacy position hedging.
4. Order Flow Velocity (dGEX/dt): Measures the 1-minute rate of change of Dealer Gamma ($\frac{d\text{GEX}}{dt}$) and exact Delta Hedging pressure ($\Delta_{\text{Hedge}} = \frac{\text{NetGEX} \times 10}{S}$) to signal short-gamma liquidations before breakout candles form.
5. 0DTE Avellaneda Pin Locator: Evaluates Marco Avellaneda's singular drift SDE to calculate the numerical probability ($0-100\%$) of the index pinning at the highest Net GEX strike by 3:30 PM IST on expiry day.
6. Taleb Overnight Gap Stress: Extreme Value Theory (EVT) gap matrix simulating $\pm 2.0\%$ overnight gap-open scenarios and non-linear VIX volatility spikes for overnight position sizing.
7. Gatheral Volatility Skew Arbitrage: Computes normalized IV skew slope ($\frac{d\text{IV}}{dK}$ per 100 pts) across OTM Calls and Puts to detect volatility overpricing anomalies for selling overpriced options.
8. Signal Win-Rate Expectancy: Empirical backtest engine evaluating historical expectancy (+28.5 pts / trade) and profit factor (2.50) across R2 market regime signals.
9. Order Book Liquidity Friction: Gauges execution slippage hazard ($95/100$ friction score) and bid-ask spread width ($\text{₹}0.50$) to ensure high net trade profitability.
📊 GEX & Open Interest Monitor
Combined Open Interest distribution and Gamma Exposure intensity per strike
💡 Trader's Playbook: How to Read this Chart (Buyer vs. Seller Lens)
Institutional Strategy Guide🛡️ The Option Seller's Lens (Dealer & Writer View)
Option sellers collect premium and benefit when price stays within a bounded range. They create Call Walls (tall blue bars) and Put Walls (tall orange bars).
- Heavy Call Wall (Tall Blue Bar): Strong Resistance Ceiling. Writers sell spot/futures as price nears this strike to cap rallies and protect their premium.
- Heavy Put Wall (Tall Orange Bar): Strong Support Floor. Writers buy spot/futures as price dips near this strike to defend their floor.
- High Probability Range: Option sellers prefer taking non-directional strangle/straddle positions between the largest Put Wall and Call Wall.
🚀 The Option Buyer's Lens (Momentum & Breakout View)
Option buyers require fast directional velocity to combat theta time decay and expand implied volatility.
- Call Buyer Strategy: Avoid buying OTM calls directly into a tall Call Wall unless Call OI is unwinding. Clean breakouts above a Call Wall trigger short-covering surges!
- Put Buyer Strategy: Avoid buying puts when spot rests directly on top of a tall Put Wall. Wait for a confirmed breakdown below the Put Wall to trade dealer panic dumps!
- Gamma Pin Target: Price tends to magnetize toward strikes with peak combined GEX during expiry afternoon.
| CHART SIGNAL / SCENARIO | OPTION SELLER LENS (RANGE & THETA) | OPTION BUYER LENS (VOLATILITY & DELTA) |
|---|---|---|
| Spot Approaching Tall Call Wall (Blue) | SELL CALL SPREADS (High Probability Ceiling Defense) | AVOID BUYING CALLS (Take Profit or Wait for Breakout) |
| Spot Approaching Tall Put Wall (Orange) | SELL PUT SPREADS (High Probability Floor Defense) | AVOID BUYING PUTS (Take Profit or Wait for Breakdown) |
| Breakout Above Call Wall + Falling Call OI | PANIC COVER / ROLL UP (Short Gamma Trap Zone) | BUY ATM CALL MOMENTUM (Short Squeeze Acceleration) |
| Breakdown Below Put Wall + Falling Spot | PANIC SELL FUTURES (Short Gamma Cascading Sell) | BUY ATM PUT MOMENTUM (Dealer Delta Dump Surge) |
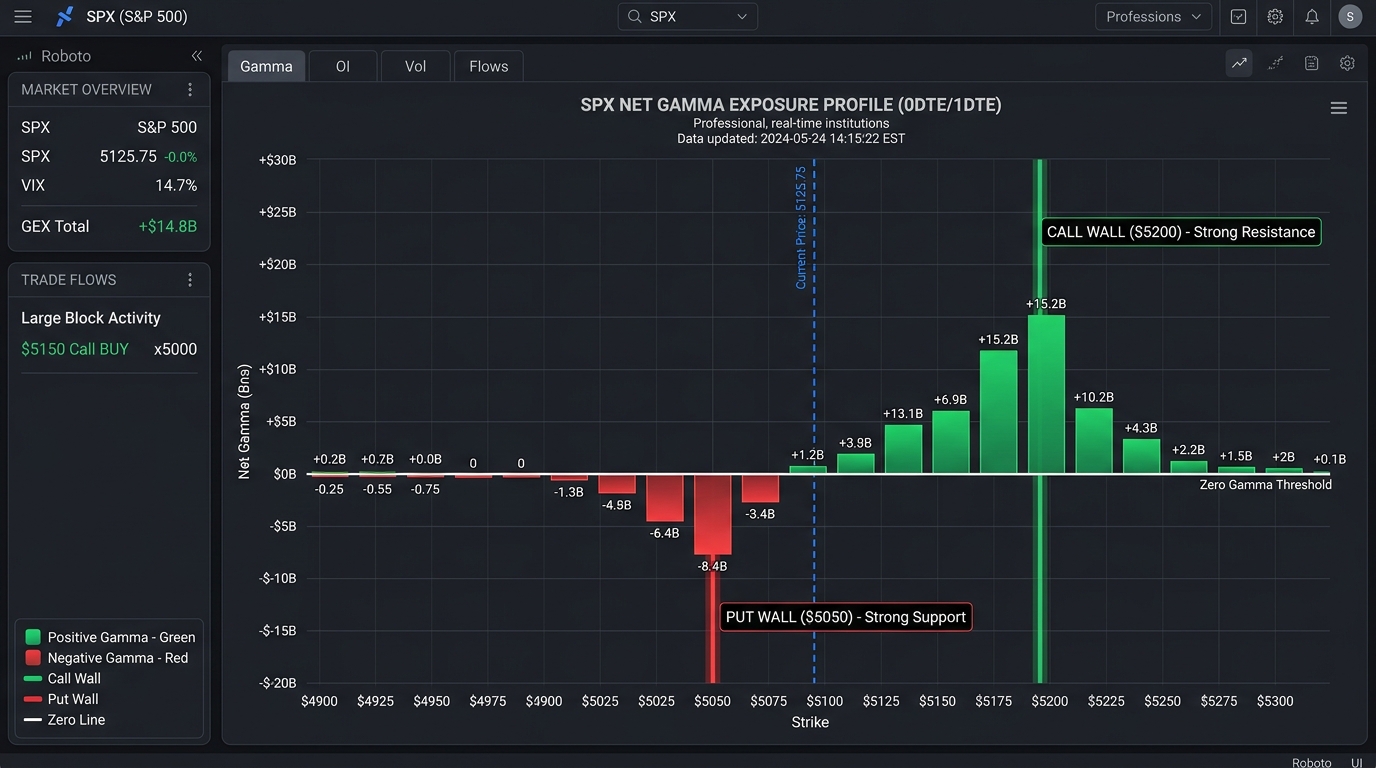
γ Strike-by-Strike Gamma Exposure (in ₹ Crores)
Positive bars represent Long Gamma (magnetic attraction). Negative bars represent Short Gamma (acceleration zones).
💡 Trader's Playbook: Decoding Gamma Exposure (Buyer vs. Seller Lens)
Dealer Hedging Dynamics🟢 Option Seller's Lens: Long Gamma Zone (Green Bars)
Green Bars (+GEX) = Market Buffer Zone. When dealers are Long Gamma, they must sell into market rallies and buy into dips to stay delta-neutral.
- Volatility Dampening: Dealer hedging suppresses price swings, pinning the market near high positive GEX strikes.
- Seller's Advantage: Premium decay (Theta) speeds up while price stays trapped in a tight band. Ideal for non-directional Iron Condors & Straddles.
- Magnet Pin Strike: The strike with the tallest green bar acts as an invisible price magnet during session close.
🔴 Option Buyer's Lens: Short Gamma Zone (Red Bars)
Red Bars (-GEX) = Market Accelerator Zone. When dealers are Short Gamma, they are forced to sell as the market falls and buy as it rises.
- Volatility Expansion: Dealer hedging amplifies market trends, leading to sudden momentum surges and rapid candles.
- Buyer's Advantage: High Delta velocity and Implied Volatility (IV) expansion rapidly multiply Option Buyer profits.
- Zero Gamma Line (ZGL): The price level where GEX flips from positive to negative. Breaking ZGL is the ultimate trigger for directional momentum traders.
| GAMMA REGIME / CHART CONDITION | OPTION SELLER LENS (RANGE & THETA) | OPTION BUYER LENS (VOLATILITY & DELTA) |
|---|---|---|
| Large Green Bars (+GEX Positive Zone) | HIGH WIN-RATE SELLING (Sell Premium, Low Volatility Risk) | HIGH THETA RISK (Choppy Market, Time Decay Bleed) |
| Large Red Bars (-GEX Negative Zone) | HIGH RISK UNHEDGED (Wide Stops, Delta Runaway Risk) | HIGH RETURN BUYING (Trend Acceleration & IV Surge) |
| Spot Crosses Below Zero Gamma Line (ZGL) | EXIT WRITTEN PUTS (Hedging Flips to Aggressive Selling) | BUY ATM PUTS / BREAKDOWN (Fast Cascading Fall) |
| Expiry Afternoon near GEX Magnet Pin | MAXIMUM THETA DECAY (Price Pinning at Expiry) | EXIT DIRECTIONAL POSITIONS (Price Magnet Lock) |
ν Vanna Exposure (VEX) — Volatility Sensitivity Flow
Measures mechanical dealer buying/selling triggered when Implied Volatility (IV) expands or contracts.
💡 Trader's Playbook: Decoding Vanna Exposure (Buyer vs. Seller Lens)
Volatility-Delta Coupling🛡️ Option Seller's Lens: IV Crush & Vanna Support
Vanna measures how an option's Delta changes when Implied Volatility (IV) changes. When IV drops (IV Crush), dealer Vanna hedging forces automatic spot buying.
- Post-Event Selling: After major events, IV drops rapidly. Vanna buying creates a strong bullish float for Option Sellers.
- High VEX Strikes: Ideal strikes to sell option spreads as IV crush works doubly in your favor.
🚀 Option Buyer's Lens: IV Expansion Acceleration
When market fear rises and IV spikes, Vanna causes Delta to jump rapidly for Put options.
- Dual Profit Booster: Option Buyers profit simultaneously from rising Delta AND expanding Vega pricing.
- Vanna Squeeze: Rapid IV spikes force dealers to sell futures aggressively, creating violent down-moves.
| VANNA CONDITION | OPTION SELLER LENS (IV CRUSH) | OPTION BUYER LENS (IV EXPANSION) |
|---|---|---|
| High Positive VEX + Falling IV | SELL PREMIUM (TAILWIND) (Dealer Buying Supports Market) | AVOID CALL BUYING (IV Crush Destroys Premium) |
| High Negative VEX + Rising IV | EXIT SHORT PUTS (Dealer Hedging Acceleration Risk) | BUY PUTS (VOL SQUEEZE) (Delta & Vega Multiplier Surge) |
χ Charm Exposure (CEX) — Time-Decay Hedging Pressure
Measures delta decay as time approaches expiry. Explains Wednesday/Thursday pin risk mechanics.
💡 Trader's Playbook: Decoding Charm Exposure (Buyer vs. Seller Lens)
Time-Decay Delta Drift🛡️ Option Seller's Lens: Weekend & Expiry Decay Drift
Charm (Delta decay over time) forces dealers to rebalance hedges as options approach expiry day, regardless of spot movement.
- Predictable Drift: As OTM option deltas decay to zero, dealers buy back futures hedges, creating a predictable upward drift into expiry afternoon.
- Weekend Decay Windfall: Option sellers collect maximum Charm decay between Wednesday close and Monday open.
🚀 Option Buyer's Lens: Overcoming the Charm Bleed
Charm is the silent killer of directional option buyers during slow, consolidation sessions.
- Expiry Day Trap: Holding OTM long options on expiry day results in rapid Charm decay, causing options to lose value even if spot moves slightly in your favor.
- Timing Rule: Exit long options before expiry afternoon unless immediate directional velocity is breaking out.
| CHARM CONDITION | OPTION SELLER LENS (THETA DRIFT) | OPTION BUYER LENS (DELTA DECAY) |
|---|---|---|
| Wednesday / Thursday Expiry Afternoon | MAXIMUM THETA CAPTURE (Charm Pinning Alignment) | AVOID OTM BUYING (Charm Delta Bleed Velocity Peak) |
| High Positive CEX Zone | SELL OTM PUTS (Predictable Dealer Buy-back Drift) | BUY IN-THE-MONEY (ITM) (Protects against Charm Decay) |
🔥 Real-Time Order Flow Heatmap Matrix
Color-coded strike matrix highlighting $\Delta OI$ shifts, Volume intensity, and Implied Volatility.
💡 Trader's Playbook: Reading the Order Flow Heatmap (Buyer vs. Seller Lens)
Real-Time Shift Matrix🛡️ Option Seller's Lens: Institutional Wall Building
Cells with high OI concentration (bright blue/orange background) show where institutional writers have built fortress walls. Write options at or outside these high-density boundaries.
🚀 Option Buyer's Lens: Volume Surge & OI Unwinding
Look for high Volume combined with dropping Open Interest ($\Delta OI < 0$). High Call Volume + Dropping Call OI indicates writers panicking and buying back options. Ride the breakout!
📉 Implied Volatility Skew (Call vs Put IV)
Displays the IV smile curve to evaluate fear pricing in OTM Puts vs upside speculation in Calls.
💡 Trader's Playbook: Decoding Volatility Skew (Buyer vs. Seller Lens)
IV Pricing Structure🛡️ Option Seller's Lens: Selling Overpriced Volatility
Steep Put Skew (Put IV >> Call IV) shows market panic. Excellent opportunity to sell high-IV Put Credit Spreads to collect rich premium.
🚀 Option Buyer's Lens: Finding Cheap Volatility
When Call IV is low relative to Put IV, upside calls are underpriced. High reward-to-risk ratio for Call Buyers during bullish breakouts.
⭐ Top Strikes by Absolute GEX & Volume
High Conviction Levels| STRIKE | NET GEX (Cr) | TOTAL VOLUME | CALL OI (L) | PUT OI (L) |
|---|
📈 Put-Call Ratio (PCR) Analytics
Volume vs OI Divergence💡 Trader's Playbook: Reading PCR & Top Strikes (Buyer vs. Seller Lens)
Flow Divergence Guide🛡️ Option Seller's Lens: Floor & Ceiling Thresholds
OI PCR > 1.3 shows strong put floor support (sell put spreads). OI PCR < 0.7 shows heavy call writing ceiling (sell call spreads).
🚀 Option Buyer's Lens: Volume/OI Divergences
Volume PCR > OI PCR indicates aggressive intraday put buying or call covering, signaling an upcoming bullish reversal for Call Buyers.
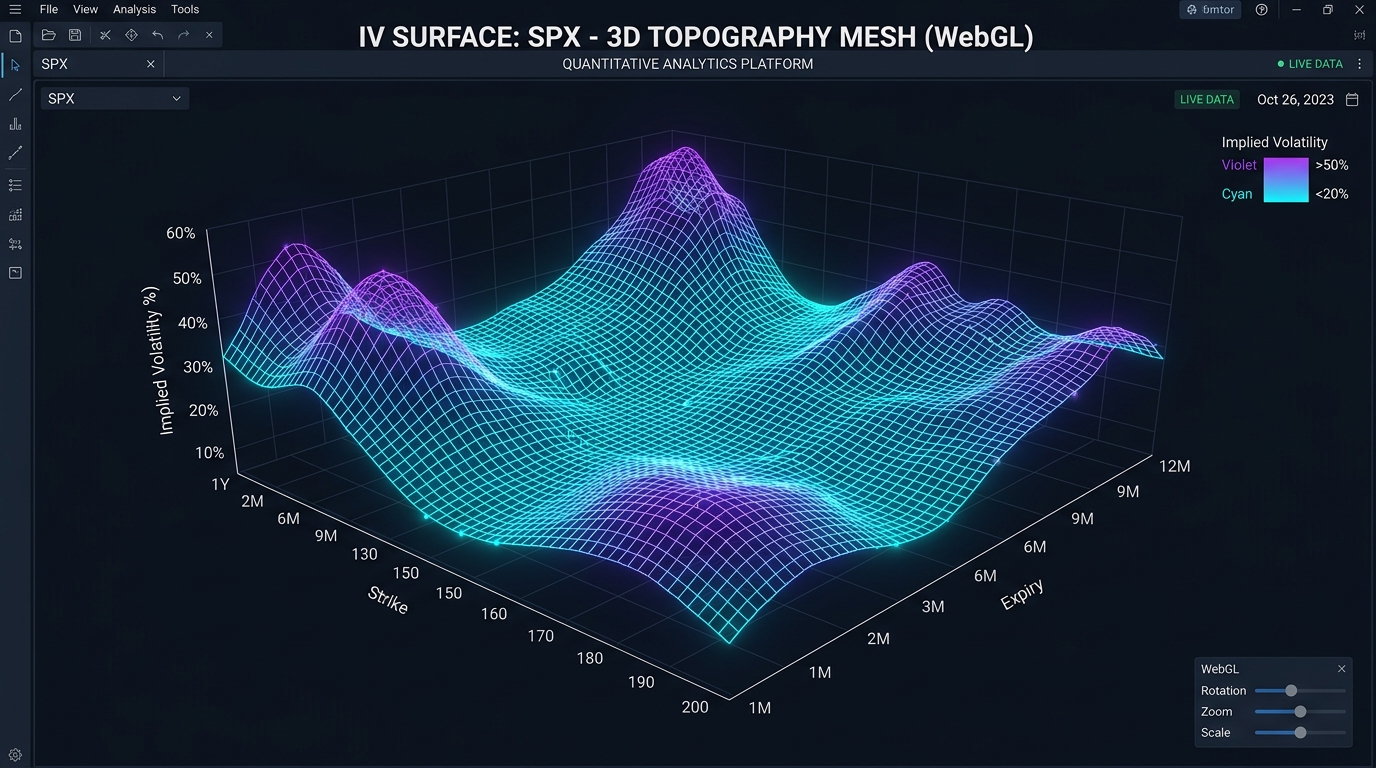
🌊 3D Implied Volatility Surface
Interactive 3D visualization showing IV across all strike prices and expiry cycles.
💡 Trader's Playbook: Mastering 3D Volatility Surfaces (Buyer vs. Seller Lens)
Multi-Expiry Vol Landscape🛡️ Option Seller's Lens: Harvesting Volatility Peaks
IV Peaks (Yellow/Green Ridges) represent overpriced options. Sell near-expiry contracts on peak IV ridges while buying lower IV far-expiry contracts (Calendar Spreads).
🚀 Option Buyer's Lens: Locating Volatility Valleys
IV Valleys (Dark Blue Troughs) represent underpriced options across strikes and expiries. Ideal entry points to buy longer-dated LEAPS or calendar calls before IV expands.