ADVANCED VOLATILITY MODELLING
3D Implied Volatility Surface & Skew
⚡ QUICK ANSWER: What is the 3D Volatility Surface?
The 3D Implied Volatility Surface models option pricing across two dimensions simultaneously: Strike Price (Volatility Skew) and Expiration Time (Term Structure). Because Black-Scholes assumes constant volatility, real-market options exhibit a curved surface. Visualizing this topography reveals institutional tail-risk pricing, IV mispricing, and Gatheral Stochastic Volatility Inspired (SVI) arbitrage bounds.
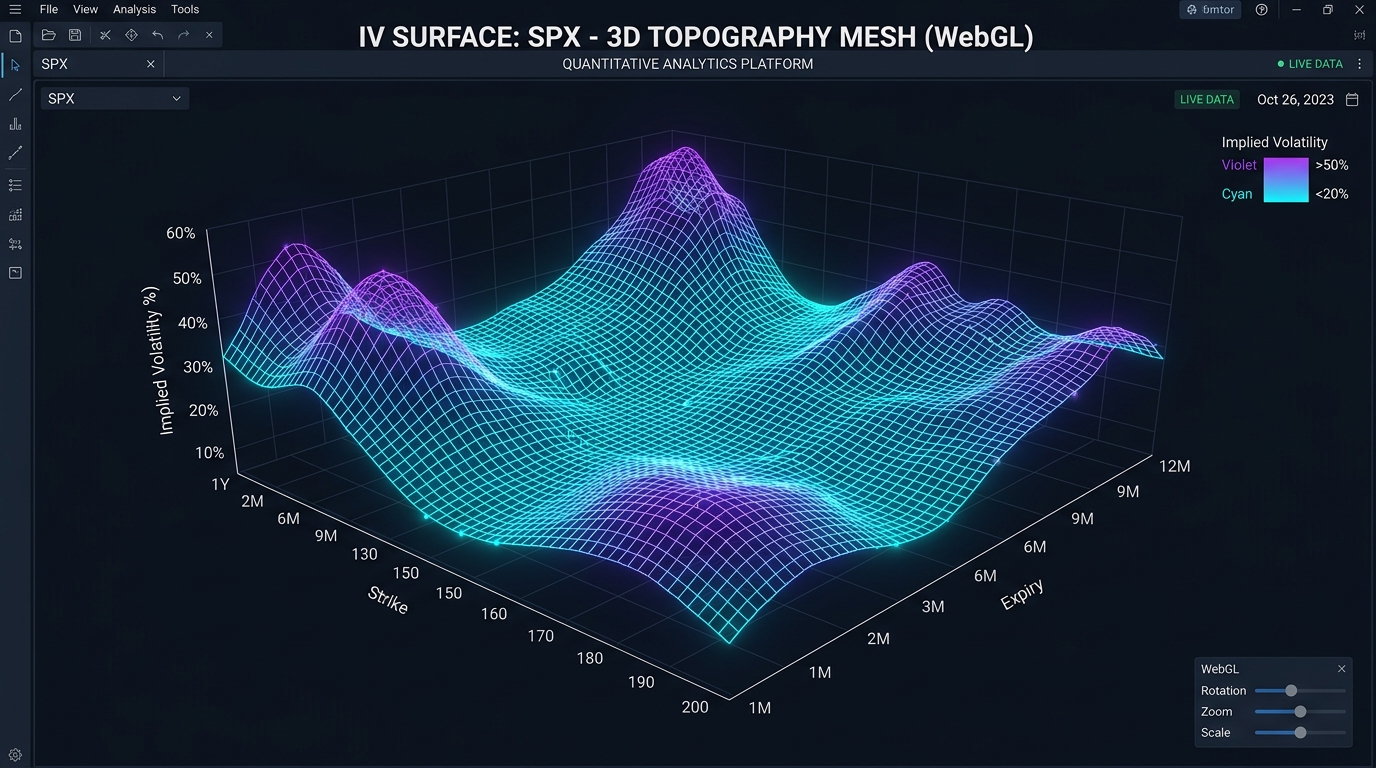
3D Implied Volatility Surface Topography across NIFTY Strike Prices & Expiries
1. The Geometry of Volatility Skew & Smile
In equity index options like NIFTY 50, OTM put options carry higher implied volatility than OTM call options. This skew arises because institutional investors aggressively buy downside puts to hedge portfolio risk, bidding up put prices and IV.
2. Volatility Term Structure (Contango vs Backwardation)
The Y-axis of the 3D surface visualises volatility across calendar expiration dates:
- Contango (Normal): Farther expiries carry higher IV than near expiries due to time uncertainty.
- Backwardation (Panic): Near-dated expiries spike above long-dated IV during market crashes or election events.